
Full-Level Value Stream Mapping 101: Healthcare Process Redesign

Price: $59.95
6.0 Contact Hours. Online/work at your own pace
A Day in the Life of a Travel Phlebotomist: Practice, Safety, and Professional Excellence
Description
6.0 Contact hours ($59.99)
Welcome To Value Stream Mapping!
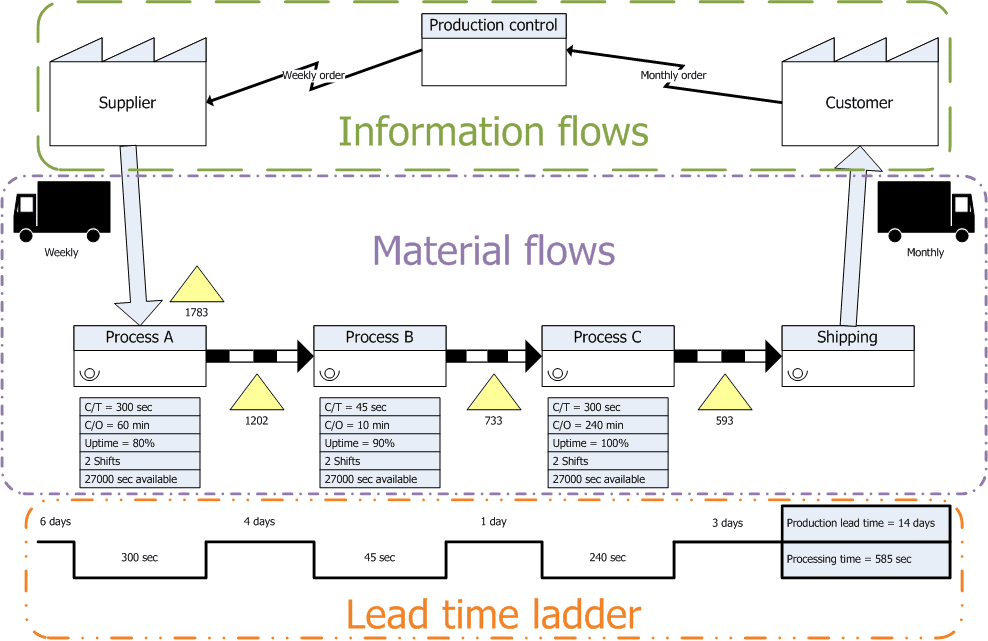
Understanding process flow is easier when you can visualize how materials, people, and information move through a system. The Value Stream Map (VSM) is a key Lean tool that makes this movement visible, allowing organizations to analyze workflows, identify inefficiencies, and improve operations.
In this course, you will learn to:
- Distinguish between value-added activities and waste within a process.
- Measure and assess process flow to identify delays, redundancies, and inefficiencies.
- Use visual mapping techniques to analyze and optimize workflows.
Through hands-on application, you will select a process from your own experience and create three sequential maps:
- Current State Map – Captures the existing workflow, highlighting inefficiencies and bottlenecks.
- Future State Map – Outlines potential improvements based on Lean principles.
- Ideal State Map – Envisions a fully optimized, waste-free process that maximizes efficiency and quality.
By the end of this course, you will have the skills to effectively use Value Stream Mapping as a continuous improvement tool, driving process optimization and enhancing overall efficiency in your work environment.
This Course Includes:
The course is presented in 5 lessons:
- In the introductory lesson, you will learn the rationale behind the Value Stream Map and and will define value.
- Unit 1 (Lesson 2) discusses essential concepts and measures.
- Unit 2 (Lesson 3) begins the construction of the map and includes detailed instruction for executing stages one through seven–diagramming flow and measuring waste.
- Unit 3 (Lesson 4) continues with stages 8 through 10–finding the barriers to flow and creating a future state map with estimated gains.
- Unit 4 (Lesson 5) is the final unit and it covers imagining the ideal state and making a plan for achieving the best design of the process.
In this course, you will learn how to develop each section of a current and future state map in a step by step format. It is helpful if you practice each step as we proceed. You may handwrite the map (this is the best option) or use the value stream map template below.
Th Course Structure:
- Five short instructional videos (total time 50 minutes)
- Case Study
- Reflection questions to facilitate critical thinking
- Quiz-10 questions
- Assignment: Create a current state map and identify conditions for improvement
Learning Objectives
At the end of this presentation the student will be able to:
- Explain the logic behind the use of the Value Stream Map
- Use and explain each element of the Value Stream Map
- Understand and apply common VSM measures: Takt Time, Cycle Time, Lead Time and Percent Efficiency
- Complete a current state and future/ideal state Value Stream Map using a process from the learner’s environment
The entire course will require approximately 6 hours and you will work at your own pace. Completion of additional reading, a reflection point and a quiz are required to obtain a certificate of completion and credit hours.
Course references can be accessed in the Materials tab at the top of this page.
References
American Society for Quality. “Quality Glossary.” Retrieved from https://asq.org/quality-resources/quality-glossary. Accessed April, 2020
American Society for Quality. “Value stream mapping.” Retrieved from https://asq.org/quality-resources/lean/value-stream-mapping. Accessed April, 2020
Deming, W. E. (1986) Out of the crisis. Cambridge, MA: Massachusetts Institute of Technology, Center for Advanced Engineering Study.
Liker, J.K. (ed.) (1998) Becoming lean: inside stories of U.S. manufacturers. Portland, OR: Productivity Press.
Tague, N.R. (2005) [1995]. The quality toolbox (2nd ed.). Milwaukee: ASQ Quality Press.
Toggl. “Takt time vs. cycle time vs. lead time.” Retrieved from https://toggl.com/takt-time-cycle-time-lead-time/. Accessed April, 2020.
Womack, J.P. and Jones, D. (1996) Lean thinking: banish waste and create wealth in your corporation. New York: Simon & Schuster.
Womack, J.P., Jones, D. and Roos, D. (1990) The machine that changed the world: the story of Lean production. New York: Harper Colins.
You must log in and have started this course to submit a review.
This course provides a comprehensive overview of the daily responsibilities and real-world experiences of a travel phlebotomist. Learners will explore the full scope of the role—from planning daily routes and adapting to diverse work environments to performing venipuncture in non-clinical settings and ensuring safe specimen transport. Emphasis is placed on patient interaction, independent practice, safety awareness, and professionalism. By the end of the course, students will be equipped with the practical knowledge and critical thinking skills needed to succeed in a mobile phlebotomy role.

Course Agenda: This Program Includes
✔ 6 Course Modules
Module 1: A Day in the Life
Module 2: Work Environment & Adaptability
Module 3: Patient Interaction & Communication
Module 4: Indépendance & Professional Responsibility
Module 5: Technical Skills in Mobil practice
Module 6: Travel Safety, and Field Changes
M
✔ Assignment –
Who Should Take This Course?

Learning Objectives
At the end of this course, you will be able to:
✔ Explain Lean principles, methodologies, and tools as they apply to clinical, administrative, and diagnostic healthcare workflows
✔ Apply Lean thinking to design a targeted improvement strategy within your healthcare or laboratory setting
✔ Plan and lead a 5S event, including preparation, implementation, and ongoing sustainment in a clinical environment
✔ Conduct a “Go and See” (Gemba) observation to uncover inefficiencies and identify opportunities for improving patient care and workflow
✔ Analyze waste and variation using a current-state value stream map to improve flow and reduce delays
✔ Apply the A3 problem-solving approach, understanding its structure and use in healthcare decision-making
✔ Plan and facilitate a Kaizen event, including defining objectives, engaging teams, and achieving measurable outcomes
This course equips you with practical Lean tools and techniques to drive continuous improvement, enhance efficiency, and improve patient outcomes across healthcare settings.
