

Free Quality Tool Lesson!
In this module, you will learn to create and interpret a Run Chart.
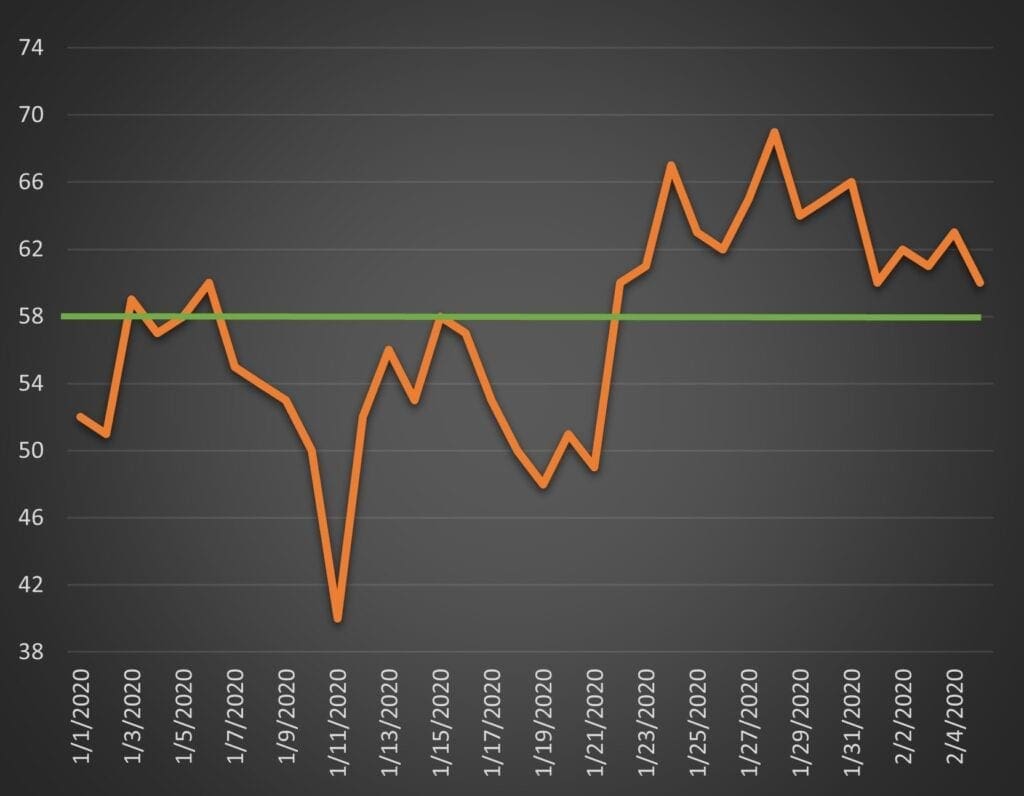
The Run Chart is an essential tool for understanding process performance. The chart makes variation over time visible.
This lesson includes:
One 8 minute video
References and resources can be accessed in the Materials tab at the top of this page.
References and Resources
Rocco, JP, Provost, LP and Murray, SK. “The run chart: A simple analytical tool for learning from variation in healthcare processes." BMF Qual Saf 2011 20: 46-21. Available from: https://www.researchgate.net/publication/49748769_The_run_chart_A_simple_analytical_tool_for_learning_from_variation_in_healthcare_processes [accessed Apr 03 2020].
The Institute for Healthcare Improvement (IHI) provides a "QI Essentials Toolkit" that includes a section on creating an using a Run Chart in healthcare. There is a template for each of the featured tools that you can download and save to your computer. The template for the run chart can be accessed here (you will need to register for the site):
http://www.ihi.org/resources/Pages/Tools/Quality-Improvement-Essentials-Toolkit.aspx
